The annual fish captures in the 28 EU member states including fisheries and aquaculture were 6.451 million tons in 2015 (EUMOFA 25/11/2016 from FAO and Eurostat) compared to 211,511 million tons world-wide. Approximately only 50% of the production is used for human consumption whereas the world-wide discards are estimated to be approximately 20,000,000 tons including processing wastes, non-target species and side stream raw materials. In EU the respective volumes of fish discards amount to approximately 5.2 million tons per year, including fish trimmings from slaughter houses, smokeries, fish canning factories, shellfish processing industries (AWARENET, 2004).
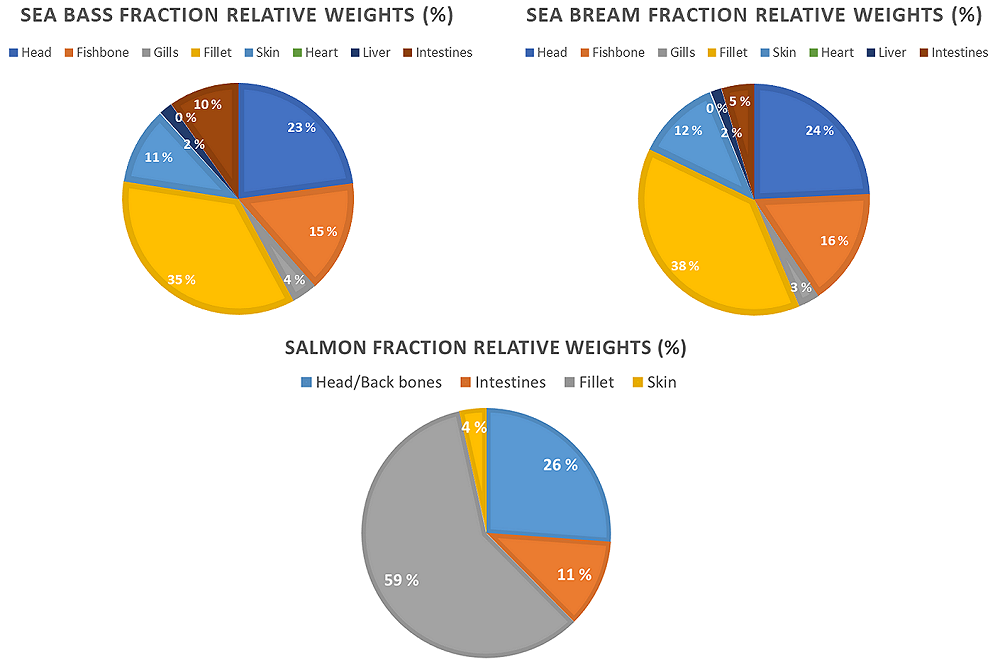
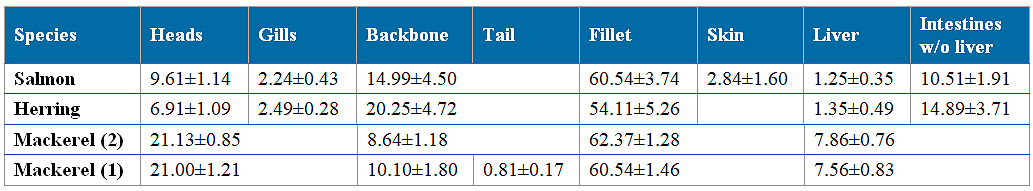
Below are listed the relative amounts of the different fish fractions deriving from round fish from fisheries and aquaculture in Norway and Europe (Figures 1.1.1 - 1.1.2; Tables 1.1.2 - 1.1.3).
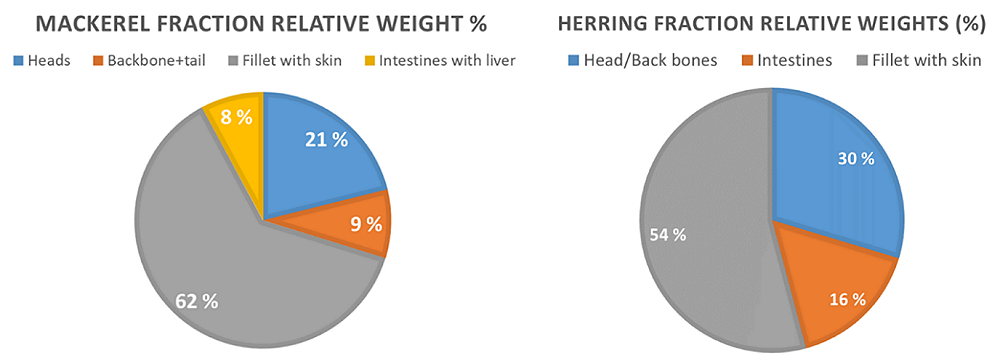
Mackerel has relatively higher proportion of heads as compared to herring and salmon, herring having the smallest heads in relative weight among the three species. Herring has however highest relative amount of backbones including the tails. Salmon and mackerel have similar proportions of fillet as compared to herring whereas visceral weight proportions are lowest in Mackerel and highest in herring (Table 1.1.2).
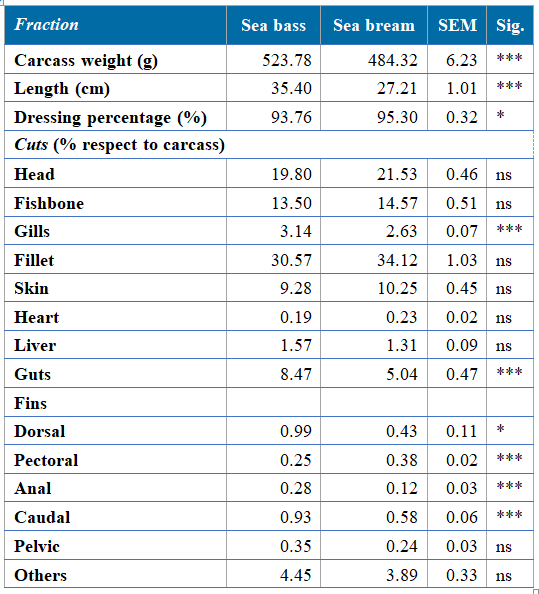
The biometric parameters and side stream fraction proportions of farmed European sea bass and Gilthead sea bream differ significant (P<0.05) for the two fish species. These differences were especially significant (P<0.001) for dressing percentage, which was higher in sea bream as compared with sea bass (95.30 vs. 93.76, respectively). Regarding filleting trimmings and side stream fractions, only gills, guts and fins showed significant (P<0.05) differences between the two species studied. The average relative proportions of heads (21.53 vs. 19.80), and fillet (34.12 vs. 30.57) usually commercialized with skin (10.25 vs. 9.28) were higher in sea bream, while there were higher proportions of the remaining fractions in sea bass.