In order to assess potential gut microorganism variations between populations of mice treated with different nutritional supplements, experimental design is of crucial importance as there are many different factors that are implicated in gut microbial consistency like sex, age and genetic background. Then, depending on the experimental design nutritional supplements can be tested as protective additives in healthy individuals or whether they possess beneficial properties against pathological conditions. In the first case, a shorter experimental protocol is preferred where mice are fed 2-3 weeks with the nutritional supplements and then sacrificed in order to isolate fecal samples, blood serum and organ tissues in order to test for macrobiota changes and potential cytotoxicity of the supplement. In addition, mice weight gain as well as food consumption is advised to be monitored during the experiment. In the second case, where pathological phenotypes have to be induced and then nutritional supplements are tested for their potential beneficial outcome, the experimental protocol is modified accordingly. For example, in case of obesity, metabolic condition largely growing in the recent years, microbiome consistency can be changed upon High Fat Diet (HFD) consumption even in 3 weeks upon the start of the experiment but it can be extended to 8 weeks for the obesity phenotype to be fully established. In order to monitor the progression and establishment of the obese phenotype it is preferred to closely monitor mice weight gain, food consumption as well perform regular Glucose Tolerance Test (GTT) to mice. GTT test provides a clear image of insulin tolerance in obese mice, an expected outcome of type-2 diabetic mice, induced by the obese phenotype. All tested nutritional supplements should be compared to HFD obese mice as well as Lean Diet (LD) counterparts. In the end of the experiment, fecal samples are collected, blood serum, organ tissue and especially abdominal fat where adipose chemokines and inflammatory mediators are expected to be elevated.
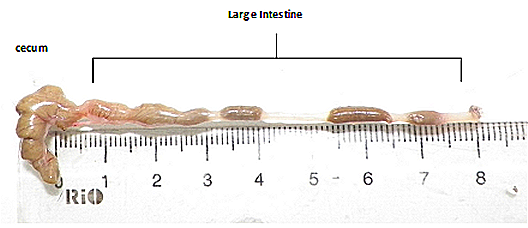
In order to diminish cross-DNA contamination during the isolation of fecal samples, proper tool sterilization should be conducted and wear of protective lab coat, goggles and gloves throughout the whole procedure. On the day of experimental termination, mice are weighted and euthanatized using standard procedure, then 70% ethanol is sprayed on the body of the mouse and it is carefully opened by a ventral midline incision. The peritoneum membrane is carefully lifted and cut so the intestine is exposed. Colon, cecum and small intestine are isolated by separating them from the stomach at the duodenum and from the anus at the distal end of the rectum. The majority of the bacterial load of the gastrointestinal track is found in the terminal ileum, cecum and large intestine mainly due to lower pH values in the small intestine closer to stomach eliminating bacterial growth (Fig. 2.6.1). After Intestine is isolated, it is put in sterile PBS and then placed in sterile petri dish where terminal ileum, cecum and large intestine are opened with successive incisions and the fecal samples are collected in 2mL eppendorfs. Samples are weighted (approximately 200mg of sample is needed) and either stored in 80 oC or proceeded immediately for DNA isolation. Excellent DNA quality is essential for further DNA sequencing analysis. To this point, DNA isolation step is optimized according to DNA extraction kit. For this project, NucleoSpin® DNA stool kit (Macherey Nagel) has been used and DNA extraction of stool samples was conducted according to manufacturer's instructions. In the end, the quantity and quality of the isolated DNA is measured using nanodrop spectrophotometer.
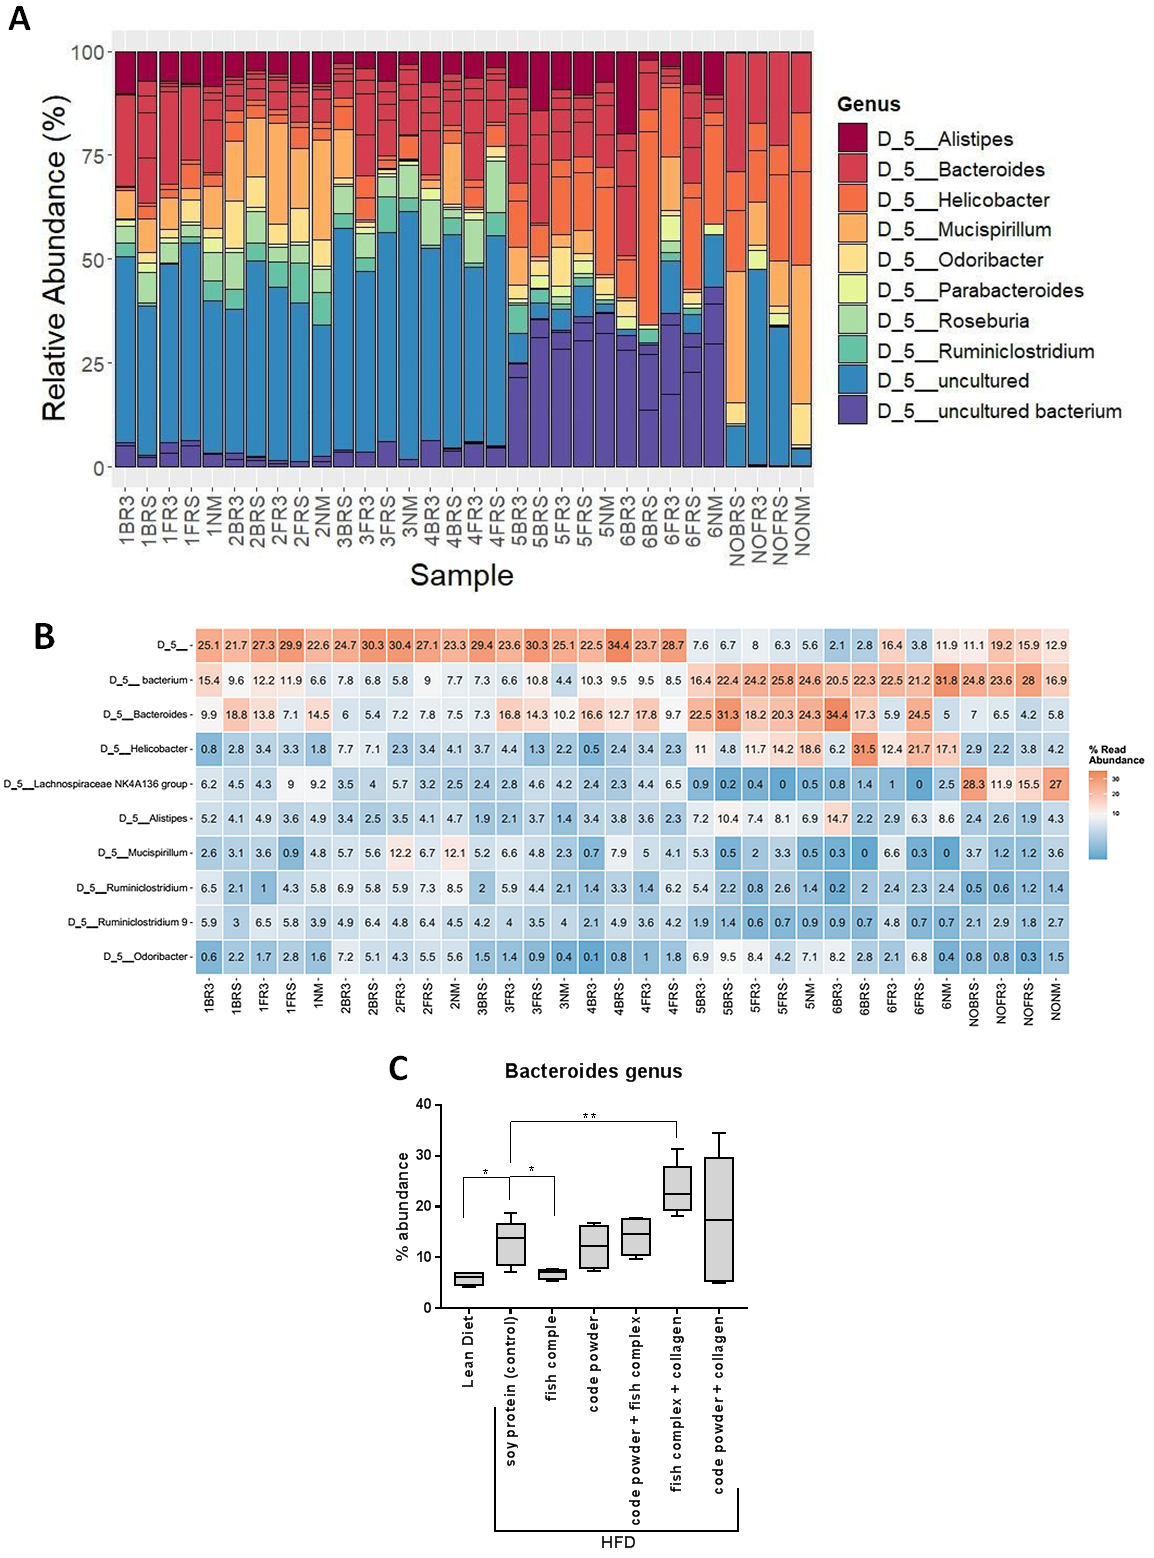
Metagenomic analysis of sample DNA was conducted by isolating and enhancing bacterial reads using for sequencing the V3 - V4 hypervariable region of the 16S rRNA gene (≈ 460bp) and applying the Illumina protocol for 16S post-genomic analyzes described in Illumina's 16S Metagenomic Sequencing Library Preparation' (15044223 B) manual. To boost V3 - V4 sequencing region polymerization primers designed by Klindworth et al., 2013 were used adding an Illumina adapter sequence at the 5' end of each primer. The size and quality of the generated library was evaluated using the Fragment Analyzer (Agilent Technologies Inc. Santa Clara, United States). Sequencing was performed in INEB genome analysis infrastructure using MiSeq platform (Illumina Inc. San Diego, California) and the MiSeq® reagent kit v3. Bioinformatic analysis of interpreted reads was performed using Qiime2 software (Quantitative Insights into Microbial Ecology, https://qiime2.org) and prokaryotic organisms were identified. Phylogenetic analysis of these organisms occurred using OTUs (Operational Taxonomic Units) based on 99% nucleotide homology to SILVA 132 database. Examples of generated graphs are represented in figure 2.6.2. The generated Stacked bar charts (Fig. 2.6.2A) and heatmaps (Fig. 2.6.2B) are then used to analyze results and conclude to box plots (Fig. 2.6.2C) for individual genus and other taxonomic units of bacteria of interest.
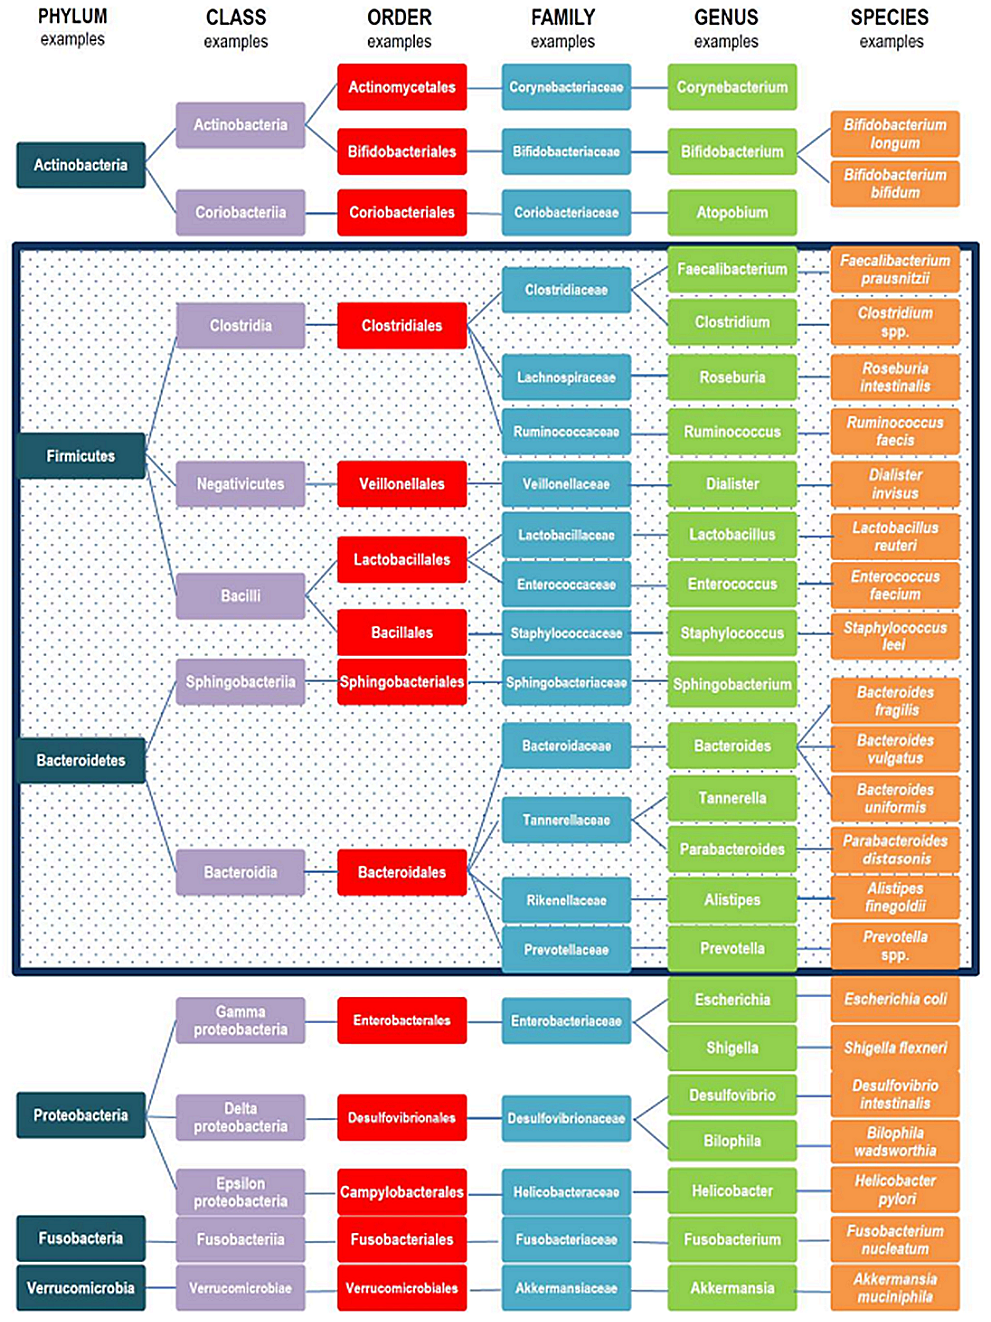
Metagenomic analysis of the 16S rRNA of gut microbiome provides a plethora of data which are usually difficult to interpretate. Bacteria are taxonomically classified according to phyla, classes, orders, families, genera and species. Hypervariable regions of the 16S rRNA gene provide the necessary nucleotide variabity to enable microorganism classification and generation bar graphs and heatmaps of microorganism's abundance according to taxonomic rank. Although, 6 phyla are predominantly found in gut microbiome Firmicutes, Bacteroidetes, Actinobacteria, Proteobacteria, Fusobacteria and Verrucomicrobia, Firmicutes and Bacteroidetes represent over 90% of gut microbiota (Fig. 2.6.3) and a gut microbial core of 37 genera has been identified as prominent in healthy mice. As mentioned above, changes in gut microbiome composition can trigger diseases; nevertheless, changes in the context of healthy microbiome are expected due to age, lifestyle, genetic background and dietary habits. As the continuous cross-talk between gut microorganisms and host immune system forms a "super-organism", certain phylogenetic taxa of microorganisms begin to be profound is health and disease. In a healthy gut microenvironment, prebiotic species from the lactic acid bacteria group are found, with the most prominent to be Lactobacillus. In addition, short chain fatty acid (SCFAs) such as acetate, propionate and butyrate producing microbes have also great beneficial functions in immune, neuronal and metabolic regulation of the host. There is a long list of butyrate producing bacteria such as members of Actinobacteria, Bacteroidetes, Fusobacteria, Proteobacteria, Spirochaetes, and Thermotogae, although the main butyrate bacteria are members of the Firmicutes, Faecalibacterium prausnitzii and Clostridium leptum of the family Ruminococcaceae, and Eubacterium rectale and Roseburia spp. of the family Lachnospiraceae. In contrast, in pathological conditions a loss in microbial richness is observed with certain microbial groups to be more prominent. For example, in Inflammatory Bowel Disease (IBD) patients an increase in Proteobacteria families has been observed whereas Lachnorpiraceae and Bacteroidetes populations are found to be decreased. Even, between ulcerative colitis (UC) and Crohn's disease (CRD) patients' distinct microbial variations have been observed. Indeed, in UC patients decreased abundance of butyrate producing bacteria Roseburia hominis and Faecalibacterium prausnitzii has been observed, whereas the opposite has been observed in CRD patients, indicating the constant dynamics between microbiome and host.