

Cell culture is a good in vitro model for bioactivity analysis since there is wide availability and easy handling for high-throughput testing. Experiments can be repetitive and targeted since not many environmental factors can affect the results. A cell-based bioassay is important to determine toxicity or potential anti-cancer or anti-inflammatory applications. Selection of cell type, culture medium, culture system (2-D or 3-D), nutrient concentrations and type of bioassay are crucial for reliable testing.
Murine macrophage cell line RAW 264.7 is easy to propagate and constitutes a good model for cytotoxicity or anti-inflammatory tests such as Nitric Oxide (NO) and inflammatory cytokines measurements. RAW 264.7 can be cultured in Dulbecco's Modified Eagle's Medium (DMEM) supplemented with 10% heat inactivated Fetal Bovine Serum and 1% penicillin streptomycin at 37 ℃ incubator with 5% CO2. Nutrient supplements in powder form are diluted in the appropriate amount of sterile water or 1X PBS while liquid supplements are initially dried using speedvac vaccum concentrator before diluted. Supplement concentration varies usually between 5 μg/mL and 500 μg/mL.
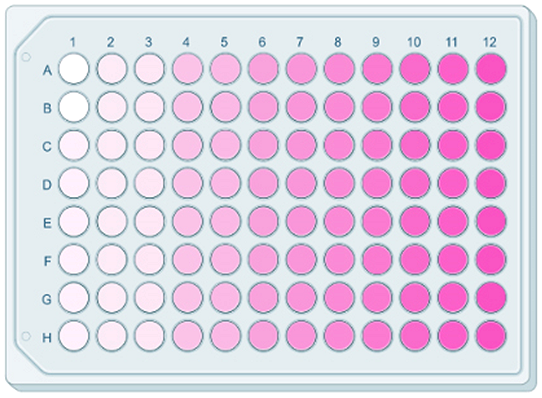
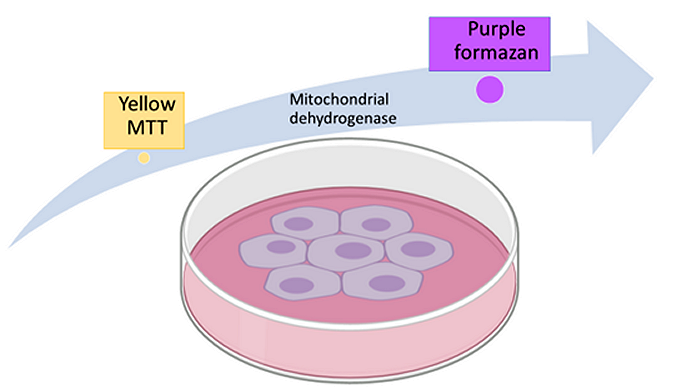
Cytotoxicity can be verified with MTT, a colorimetric assay which includes Thiazol Blue Tetrazolium Bromide and can measure cell viability and proliferation. It is based on the reduction of a yellow tetrazolium salt (3-(4,5-dimethylthiazol-2-yl)-2,5-diphenyltetrazolium bromide or MTT) to purple formazan crystals by metabolically active cells in a NADH - NADPH dependent manner. To perform this assay, 5 x 10⁵ RAW 264.7 mouse macrophages should be seeded in 96-well plate and cultured overnight. The next day, cells should be treated with the respective nutrient supplement concentration and incubate for 24, 48 or 72 hours at 37 ℃. Thiazol Blue Tetrazolium Bromide (MTT) must be added to cell culture in a final concentration of 500 μg/mL and incubated at 37 ℃ plus 5% CO2 for 4 hours. Supernatant should be discarded and cells lysed with 0.4% v/v HCl in isopropanol. Absorbance can be measured in a microplate reader between 500 and 600nm. To evaluate results, the average OD of each treated sample should be normalized to the absorbance of the control sample and statistical analysis could be performed via GraphPad Prism or any related tool.
Comet assay, alternatively known as single gel electrophoresis assay, is a simple and inexpensive technique for DNA damage evaluation. It was first introduced by Ostling and Johanson in 1984 and was furtherly modified by Singh and co-workers in 1988. A well described protocol has been published by Olive and Banath. The concept is that damaged DNA, containing breaks, would migrate further towards anode during gel electrophoresis compared to large and cumbersome undamaged DNA. This assay is important for the evaluation of toxicity of some supplement, in the DNA level. Cells are embedded in low-melting point agarose 1% w/v in distilled water, cast onto mini-slides and lysed before electrophoresis. Slides can be stained either with Ethidium Bromide or other fluorescent dye (e.g. SYBR-green, DAPI) and observed under UV-light. Tail intensity and length can be analyzed to determine the DNA damage.
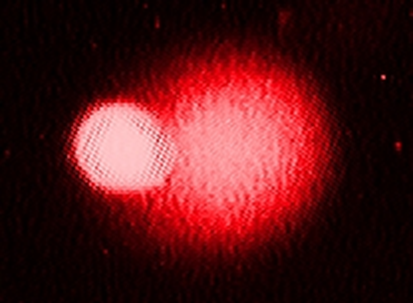
The cell culture model is also useful for evaluation of apoptotic events after nutritional supplements treatment. Pro- (caspase-3, Bax) and anti-apoptotic (BCL-2) proteins can be detected and quantified in both mRNA level with real time PCR and protein level with western blot. Additionally, annexin-V is a well-established assay for apoptotic cell death and mitochondria damage measurement. Human vascular anticoagulant, annexin-V, is a Ca2+-dependent phospholipid-binding protein with high affinity with phosphatidylserine residues on the cell membrane. Physiologically, these residues are on the inner part of the cell membrane, thus inaccessible to annexin-V. However, early during apoptosis, phosphatidylserine residues are flipped on the outer part of the cell and annexin-V is able to react with these cells. When annexin-V is hybridized with fluorescein isothiocynate conjugate (FITC) or other fluorescent dye, signal will depict apoptotic cell ratio and can be measured with flow cytometry. After incubation of cells with the desired supplement, the method includes discarding supernatant of cell culture, washing with PBS and detaching cells from the bottom, using scratcher, trypsin/EDTA or other way, depending on the cell type. For RAW 264.7, scratching the bottom is sufficient. If trypsin is used, addition of 10% fetal calf serum (FCS) in media, is necessary for the inactivation of trypsin. Cells are then centrifuged at 1000 rounds per minute for 5 minutes and resuspended in fresh DMEM. Three controls are recommended for each assay: unstained cells to for background florescence, cells stained only with Propidium Iodine (PI), cells stained with only annexin-V/FITC. Treated cells are resuspended in 500 μL 1X binding buffer and 5 μL of annexin-V/FITC and 5 μL of Propidium Iodine are added. Samples are incubated at room temperature for 5 minutes in dark. Flow cytometer is customized and unstained cells are used to adjust red and green fluorescence until all cells are inside lower left quadrant. Next, the green annexin-FITCH is adjusted to the lower half display and red background is equilibrated. Promidium Iodine sample is adjusted to the left side of the display and green fluorescence background is equilibrated. Then, treated samples can be tested and analysed based of the four populations that will be on display. An alternative is to detect apoptosis by fluorescence microscopy by putting cell suspension on a glass slide fixed or not. Incubation with annexin-V/FITC should be performed prior to fixation. The slide can be observed with a dual filter for FITC and rhodamine. Green plasma membranes have bound annexin-V/FITC while cells with disrupted membrane integrity will appear red (PI) in the nucleus and green on the cell membrane (https://www.abcam.com/protocols/annexin-v-detection-protocol-for-apoptosis).
Poly(ADP-ribose) polymerase (PARP) cleavage is another way to estimate apoptosis since it occurs as a result of the activity of caspase-3 and is associated with chromatin condensation, a hallmark of apoptosis. Specifically, the 116 kD PARP protein is cleaved into 89 kD and 24 kD polypeptides by caspase-3. This event can be detected and quantified with western blot since specific antibodies can detect both 116 kD and 89 kD fragments.