

This section provides an overview of the chemical compositions of different pelagic and farmed fish species and their different side stream fractions as analysed in the scope of the AQUABIOPRO-FIT project. The chemical composition of fish tissues may vary according to fish size and season, and in the case of farmed fish also related to feed composition. The main chemical characteristics of major fish species fished or farmed in Norway (Herring, Blue whiting, mackerel and Salmon) and those farmed in the Mediterranean (Gilthead sea bream and European sea bass) are discussed in this section.
Crude protein in fish tissues is usually determined by the Kjeldahl method (ISO 5983-1997) which quantifies nitrogen (N) in the material which can then be multiplied by a factor to provide the protein amount in the analysed sample. The factor 6.25 is usually applied in the case of fish protein but may vary from tissue to tissue. Fish tissue moisture and ash can be determined gravimetrically after drying pre-weighed samples in porcelain cups at 105℃ for 24 h and then incinerating the dried samples at 500℃ for 12 h (ISO 6496-1999 and ISO 5984-2002, respectively). Total lipid in raw materials and body tissues can be quantified by several methods such as Bligh & Dyer extraction method (1959), Folch (1967) and others. For the analysis of total amino acid profile, samples can be hydrolysed in an acid solution (6 M HCl for 22 h at 110℃) and analysed by HPLC using a fluorescence technique for detection (Cohen and Michaud, 1993). Total phosphorous (P) can be determined by a spectrophotometric method (ISO 6491-1998). The water-soluble fraction of fish tissues can be extracted with boiling water and then the extract can be filtered using paper filter, and the crude protein content in the water phase determined by the Kjeldahl method. Analysis of fatty acid composition is commonly realised in Bligh & Dyer extracts by gas chromatography (GC).
The chemical composition of different fish species and fish fraction varies significantly. In Table 1.1.4 below is listed the analysed protein, fat, ash, and water content of different herring fractions as analysed in the scope of the AQUABIOPRO-FIT project.
| Herring | Fillet with skin | Backbone with tail | Guts with liver | Heads with gills | Skin | Fillet | Intestines | Liver | Gills | Heads w/o gills |
|---|---|---|---|---|---|---|---|---|---|---|
| Protein | 16.6 | 17.3 | 20.0 | 12.3 | 6.1 | 18.0 | 20.4 | 17.1 | 12.0 | 12.4 |
| Fat | 19.9 | 14.8 | 13.7 | 13.6 | 25.3 | 15.5 | 10.1 | 7.0 | 9.7 | 15.4 |
| Ash | 1.02 | 2.34 | 1.28 | 5.40 | 0.49 | 1.41 | 1.96 | 2.06 | 5.72 | 5.29 |
| Water | 62.5 | 65.5 | 65.0 | 68.7 | 68.1 | 65.1 | 67.6 | 73.9 | 72.6 | 66.9 |
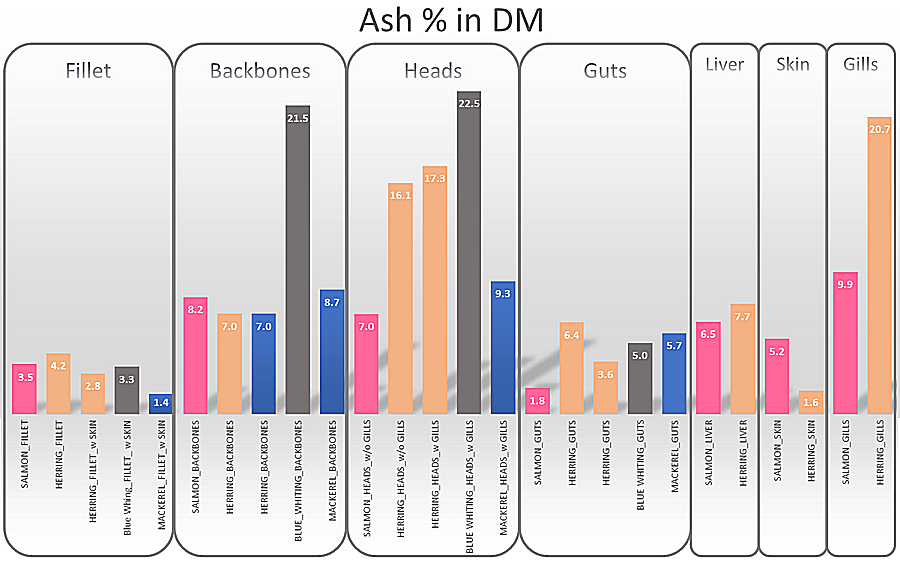
Often are the different fish fractions analyzed in dry form, which is easier to handle and preserve. In figure 1.1.3, the ash (minerals) composition of different fish fraction of salmon (pink), herring (orange), blue whiting (gray) and mackerel (blue). The backbone, head and gill fractions are the richest ones in minerals, with higher levels present in Blue whiting among the considered species.
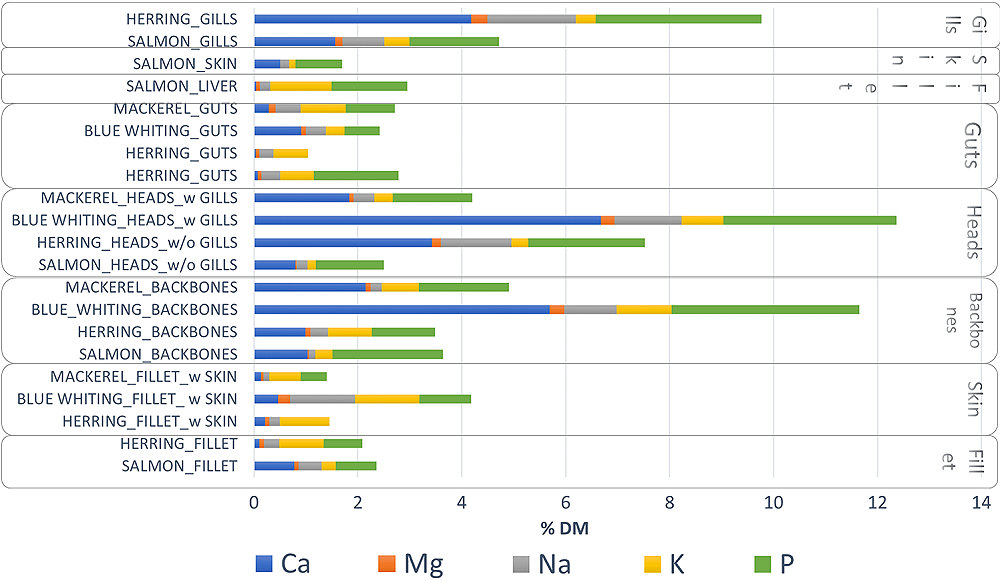
In Figure 1.1.4, the analysed macrominerals (Calcium: Ca, Magnesium: Mg, Sodium: Na, Potassium: K and Phosphorous: P) content of different fish species and tissues (in dry matter DM). Blue whiting is the species that, as in the case of ash, contained the highest levels of calcium, magnesium and phosphorous in fractions that are rich in bone tissue, such as heads and backbones.
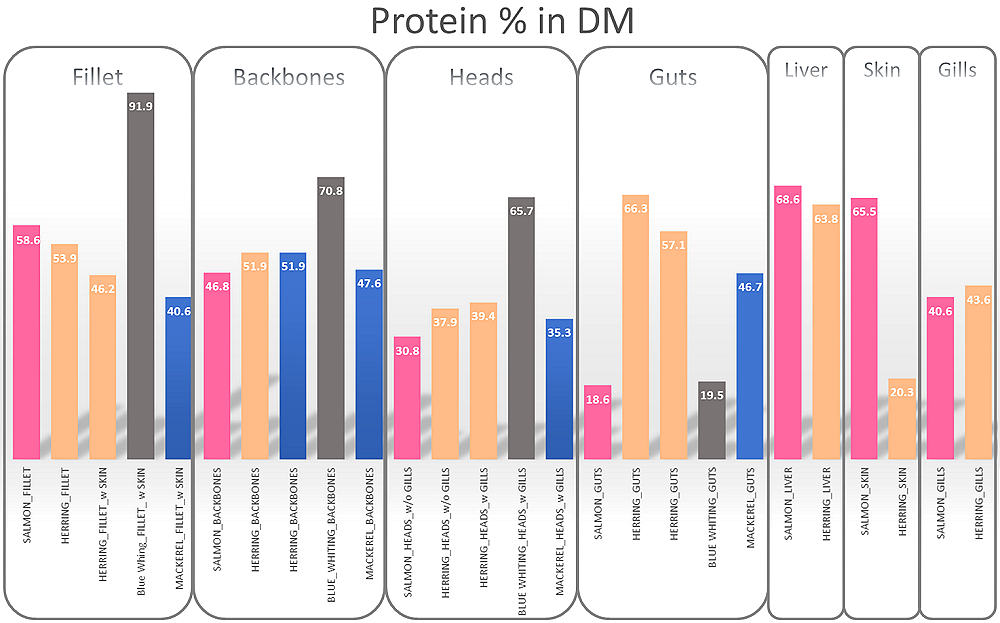
The protein content of fish tissues is high in general varying according to the respective lipid and ash levels. The protein levels of different tissues in salmon, herring, blue whiting and mackerel (in DM) are presented in Figure 1.1.5 below.
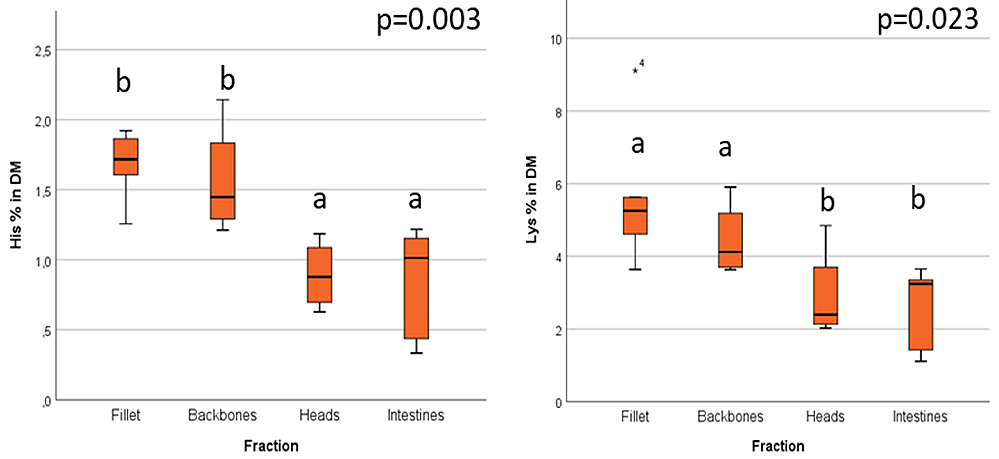
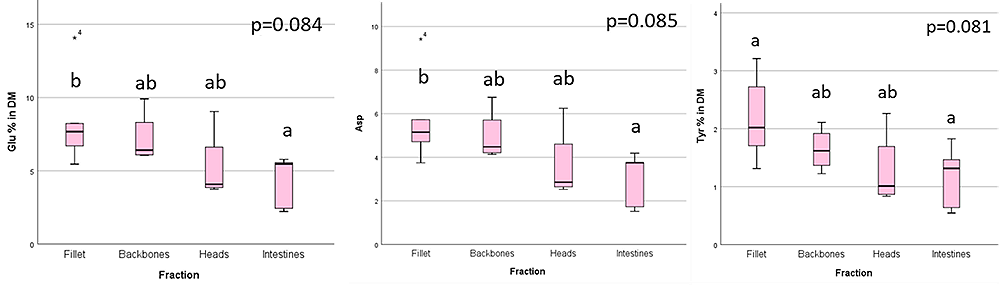
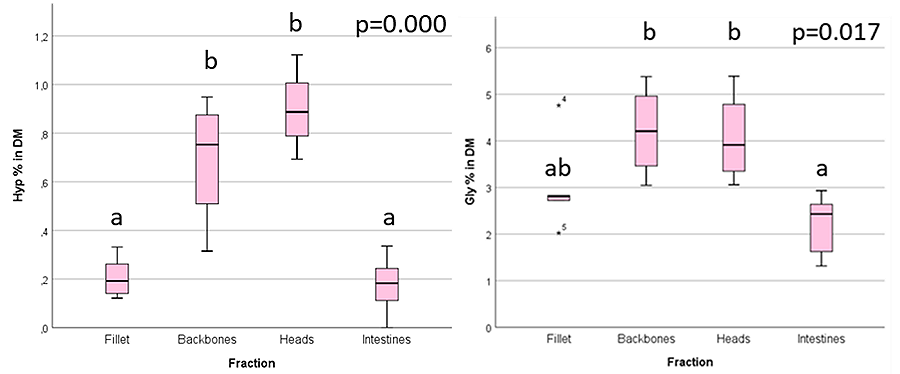
The levels of essential amino acids such as histidine (His) and lysine (Lys) were found to be higher in filet and backbone fractions as compared to heads and intestines (in DM) (1.1.6). The same pattern was observed also in the case of non-essential amino acids glutamic acid (Glu) aspartic acid (Asp) and tyrosine (Tyr) (Figure 1.1.7) however the differences among the different tissues in this case were less prominent. Different pattern is observed in tissues that are richer in connective tissue (such as backbones and skins) where higher levels of amino acids hydroxyproline (Hyp) and glycine (Gly) were found, as those are the predominant amino acids in collagen (Figure 1.1.8).
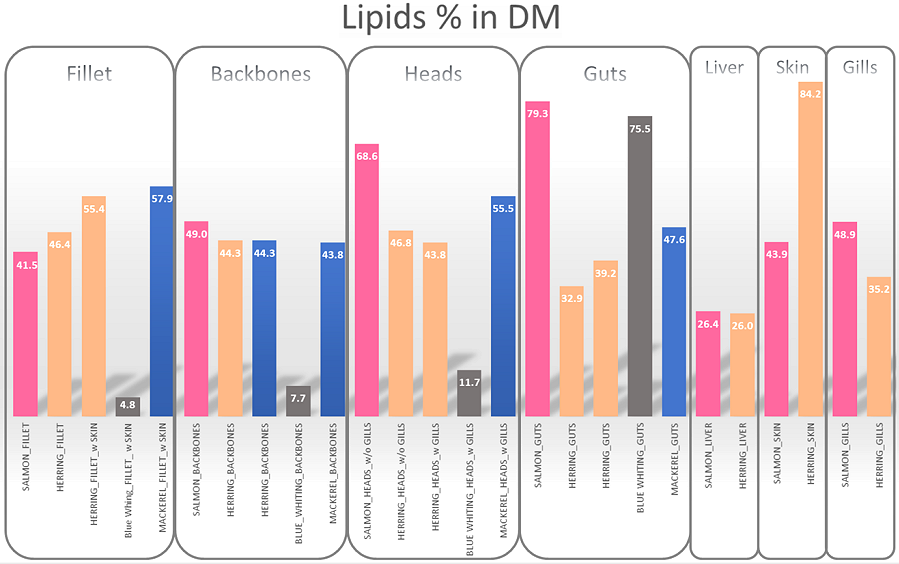
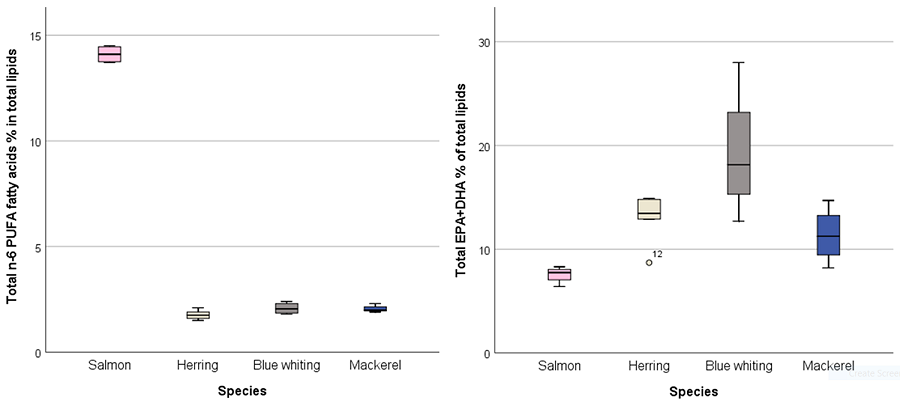
Unlike protein and ash levels was the level of lipids lowest in fillet and backbone and head fractions in blue whiting as compared to the other analysed species. Lipid levels were in general higher in the main side stream fractions (heads, backbones, and guts) of salmon as compared to herring, mackerel, and blue whiting (Figure 1.1.9). Last, salmon fractions contained significantly higher levels of n-6 PUFA and lower levels total EPA+DHA as compared to herring, blue whiting and mackerel (Figure 1.1.10).
Moisture contents in sea bass and sea bream fractions as analysed in the scope of the AQUABIOPRO-FIT project ranged between 37.61 and 72.71%, with fillet containing the highest amounts. Guts, head and skin are fish fractions with the highest fat content both in sea bass and sea bream, with values of 53.12, 35.27 and 17.10% in sea bass, and 34.11, 25.76 and 26.78% in sea bream, respectively. In terms of protein, the fillet and skin contained the highest amounts (higher than 20%), followed by gills, head, and fishbones. Differences among the two species studied and the different fractions were analysed also in terms of their mineral content (analysed as ash). Fishbone, gills, and head are the parts that contain higher ash amounts (greater than 5% of the total whole-body composition). Among the most abundant macro-minerals in fish are Ca and P, the content of which varies, however, depending on the analysed tissue. Higher Ca contents were observed in head and fishbone, while P is the predominant mineral in fillet and liver.
The content and composition of specific fatty acids are important for assessing the nutritional quality of fish. Lipid contents are highly variable both between and within fish species and fractions. Monounsaturated fatty acids (MUFA) are the predominant fatty acids in fish lipids (42--49 and 45-48 g/100 g of fatty acid methyl esters (FAMES) for sea bass and sea bream, respectively) followed by polyunsaturated fatty acids (PUFA) (27-32.0 and 31-34 g/100 g of FAMES for sea bass and sea bream, respectively) and saturated fatty acids (SFA) (25-26 and 20-218 g/100 g of FAMES for sea bass and sea bream, respectively).
The analysed concentrations of total polyunsaturated fatty acids (PUFA) (32 and 34 g/100 g of FAMES for sea bass and sea bream, respectively), n-3 PUFA (19 and 14 g/100 g of FAMES for sea bass and sea bream, respectively) and long chain n-3 PUFA (16 and 9 g/100 g of FAMES for sea bass and sea bream, respectively) were higher in the fillet. These differences were mainly due to the differences in C20:5n-3 (eicosapentaenoic acid or EPA) and C22:6n-3 (docosahexaenoic acid or DHA) contents, which are the main recognised health promoting fatty acids in fish oils.
The amino acid profile of sea bass and sea bream fillet and side stream fractions differed with the skin, guts, liver, and gills containing predominantly non-essential amino acids, whereas the fillet had higher contents of essential amino acids. The major amino acid in sea bass and sea bream tissues was glutamic acid, which represented around 10% of total amino acids. The ratio of essential/non-essential amino acids ranged between 0.64 and 1.08 and in the different fractions analysed, with fillet having the highest and gills the lowest value. (more)